World Cup: African Record Against Other Confederations….
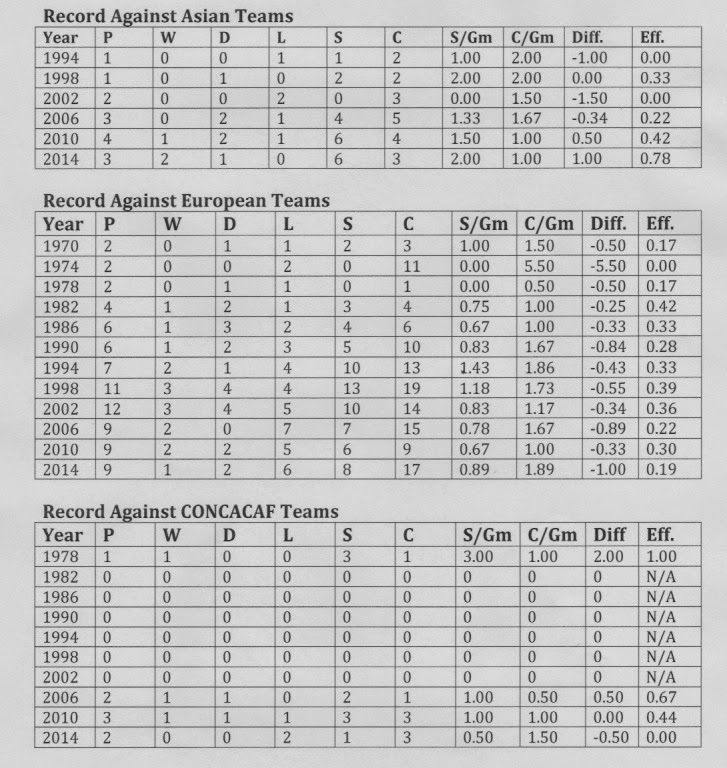
It is important to take a look at the records of African teams against other confederations particularly since African teams have historical struggles making it out of the opening round of the World Cup. But first acknowledge that, for first time, multiple African teams have moved past the opening round of the World Cup and, thus, there may well be a light at the end of a long dark tunnel.
Though the World Cup began in 1934, we have used data from 1970 because that is the first time Africa received an automatic berth to the World Cup final. One quirk to the data is that African teams had rarely played against a team from CONCACAF until 2006 and, in addition, sometimes there is just a single game against a Confederation. Those quirks are important because they can skew the data. Thus, read with caution.
Pay attention to the efficiency scores (Eff.) in the extreme right column. Understand that an efficiency score between .30 and .50 is not necessarily bad. Why? efficiency scores are based on points awarded in a game and because a draw is just one point (.30) and, thus, not .50 of three points (win), a team may have less than .50 and still hold its own. Lets take an example, Cameroon's three draws in three games (no defeats) in 1982 leads to an efficiency score of .333 and not .50! In essence, efficiency scores are focused on ability to collect maximum points. Therefore, .30 + efficiency score is not bad in the larger scheme of things.
The data, not surprisingly, show that African teams have difficult times with European and South American teams. In Europe's case, African teams have achieved improved results since 1978 when we had efficiency scores of less .30. Since 1982, African teams have consistently recorded wins over European teams. Against South American teams, the results have been mixed with good results in the 1982, 1990, and perhaps 2002 but African teams have lost all games against South American teams since!
African teams have been quite comparable to CONCACAF teams but less so against Asian teams until recently. In fact, it appears that African teams have finally made a leap over the Asian teams. However, this must be stated cautiously as positive results against Asian teams in the World Cup have been quite recent and a pattern has not been convincingly established.
So what does all this mean? Apart from contests against South American teams, African teams have somewhat held their own against teams from other regions. However, for African teams to move to the next level of becoming contenders for the World Cup the teams need to begin achieving efficiency scores that go beyond what they are today. The scores need to be closer to .60 where we are holding an advantage and not simply breaking even or being close.
***To learn more about Nigerian soccer statistics checkout CHUKASTATS at Amazon.com books.***


Comments
Post a Comment